
Making the Case for Shilling Home Prices
Misinterpreting the Case Shiller Index can lead to wildly dangerous conclusions
September 05, 2023
By Willie J. Costa & Vinh Q. Vuong
There’s plenty of arguments to be made about the affordability of housing, some even going so far as to directly blame the Fed for exacerbating the housing crisis. Yes, homebuilders are absolutely going to forego new-starts when mortgage rates spike, because a rising-rate environment pushes demand off a cliff; no one is going to spend money building a product they don’t think they can sell. And yes, the Fed deserve plenty of the blame for not acting sooner (we’ve mentioned this several times before), although calls for the Fed to set mortgage rates are a bit extreme, grossly discount the importance of a free market, and trend far too much toward totalitarianism for our liking.
Panic over the death of housing affordability, however, is greatly exaggerated. It’s dangerous to draw conclusions from only a subset of data, and far more dangerous to predict the future from those inherently faulty conclusions, yet that’s exactly what seems to be happening in this case. Let’s examine the Case Shiller index a bit deeper and understand why.
Background on the Case Shiller Index
The Case Shiller Index (currently the Standard & Poor’s CoreLogic Case-Shiller Home Price Indices, which we’ll abbreviate to “CSI”) is actually a set of four indices focusing on repeat sales of single-family homes. Thus, it’s immediately apparent that conflating housing affordability with house affordability can lead one to erroneous conclusions. The CSI is divided into:
and are normalised to a value of 100 for January 2000. The CSI traces its origins to the work of two university professors – unsurprisingly named Karl Case and Robert Shiller – who calculated home price values back to 1990. This difference in indexing poses yet another chance at obfuscation when reporting CSI results: the different index dates for CSI = 100 yield vastly different results in calculations. The fact that the CSI also only focuses on repeat, same-home sales means that using it as the sole (or primary) source of data about the housing market will result in some wildly incorrect conclusions, as will be detailed later.
As an interesting historical note, Case developed his portion of this methodology in an effort to study pricing trends for repeat-sales using data from early 1980s Boston, which at the time was going through a housing boom (which was at least partially fueled by speculation… why does that sound familiar?). Shiller had been researching economic bubbles, and together with Case formed housing price indices for cities nationwide. While Shiller claims to have seen some early signs of the 2006-2012 real estate meltdowns[1], the predictive power of the CSI remains in dispute. After all, home prices have risen fairly reliably – even when normalised by median family income (see Fig. 1) – since the 1960s (see Fig. 2), and have increased since the end of World War II.
By Willie J. Costa & Vinh Q. Vuong
There’s plenty of arguments to be made about the affordability of housing, some even going so far as to directly blame the Fed for exacerbating the housing crisis. Yes, homebuilders are absolutely going to forego new-starts when mortgage rates spike, because a rising-rate environment pushes demand off a cliff; no one is going to spend money building a product they don’t think they can sell. And yes, the Fed deserve plenty of the blame for not acting sooner (we’ve mentioned this several times before), although calls for the Fed to set mortgage rates are a bit extreme, grossly discount the importance of a free market, and trend far too much toward totalitarianism for our liking.
Panic over the death of housing affordability, however, is greatly exaggerated. It’s dangerous to draw conclusions from only a subset of data, and far more dangerous to predict the future from those inherently faulty conclusions, yet that’s exactly what seems to be happening in this case. Let’s examine the Case Shiller index a bit deeper and understand why.
Background on the Case Shiller Index
The Case Shiller Index (currently the Standard & Poor’s CoreLogic Case-Shiller Home Price Indices, which we’ll abbreviate to “CSI”) is actually a set of four indices focusing on repeat sales of single-family homes. Thus, it’s immediately apparent that conflating housing affordability with house affordability can lead one to erroneous conclusions. The CSI is divided into:
- A national home price index
- A 20-city composite index
- A 10-city composite index
- A collection of indices focusing on 20 individual metropolitan areas
and are normalised to a value of 100 for January 2000. The CSI traces its origins to the work of two university professors – unsurprisingly named Karl Case and Robert Shiller – who calculated home price values back to 1990. This difference in indexing poses yet another chance at obfuscation when reporting CSI results: the different index dates for CSI = 100 yield vastly different results in calculations. The fact that the CSI also only focuses on repeat, same-home sales means that using it as the sole (or primary) source of data about the housing market will result in some wildly incorrect conclusions, as will be detailed later.
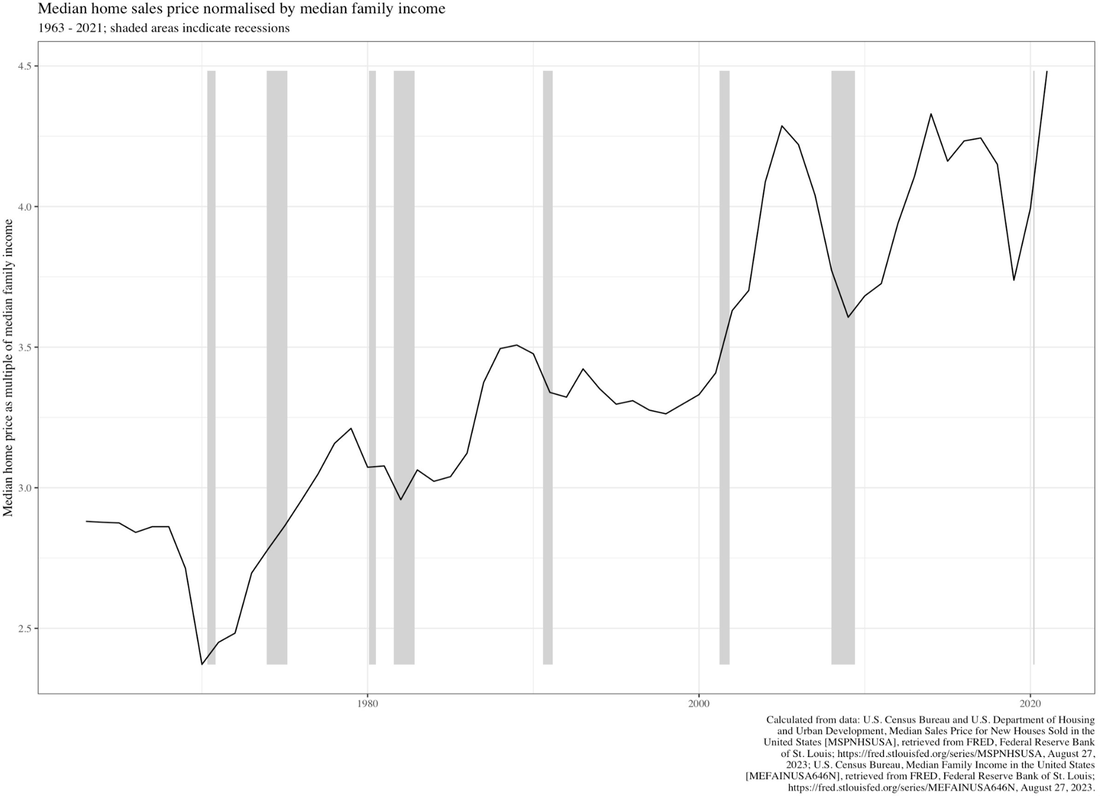
As an interesting historical note, Case developed his portion of this methodology in an effort to study pricing trends for repeat-sales using data from early 1980s Boston, which at the time was going through a housing boom (which was at least partially fueled by speculation… why does that sound familiar?). Shiller had been researching economic bubbles, and together with Case formed housing price indices for cities nationwide. While Shiller claims to have seen some early signs of the 2006-2012 real estate meltdowns[1], the predictive power of the CSI remains in dispute. After all, home prices have risen fairly reliably – even when normalised by median family income (see Fig. 1) – since the 1960s (see Fig. 2), and have increased since the end of World War II.
[1] Shiller, Robert (2005). Irrational Exuberance. Princeton University Press. p. 13. ISBN 978-0-691-12335-6
Figure 1: median home sales price normalised by median family income. Source: FRED.
Figure 1: median home sales price normalised by median family income. Source: FRED.
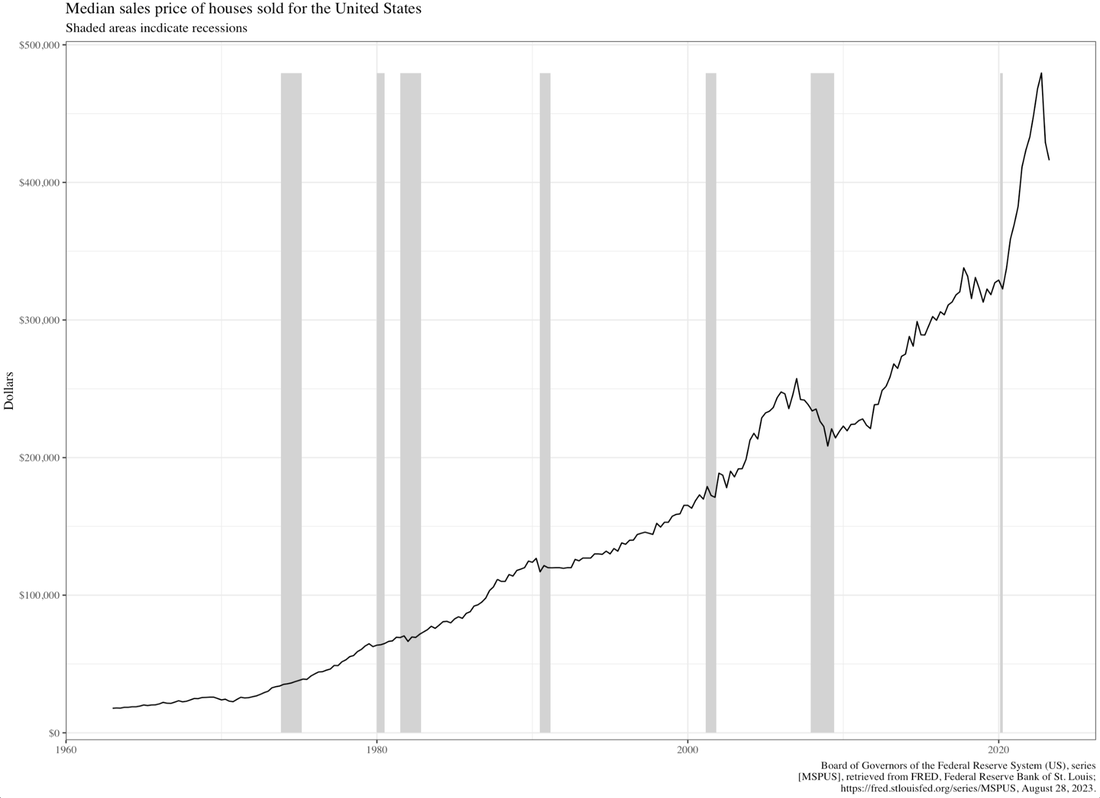
Figure 2: median sales price of homes sold, nationwide. Source: FRED.
The CSI ignores two important factors in real-world housing affordability: imputed rent (necessary to measure economic activity in national accounts) and mortgage interest deduction, both of which have very real profit/loss considerations for homeowners and would-be homeowners. More importantly, using CSI to forecast perpetual doom in the housing market ignores an important historical trend that could cause detrimental impact to housing speculators.
The economic reality of Case Shiller
Speculation is little more than degenerate gambling on a large scale, but unfortunately the knock-on effects are not limited to the ultra-high net worth individuals and corporations: they impact regular, everyday Americans, usually in negative ways.
Contrary to popular belief, there has been no continuous uptrend in US home prices in real terms. This statement will undoubtedly cause much wailing and gnashing of teeth, but perhaps one should occasionally pause and remember that perhaps Professor Shiller is a Nobel laureate for a reason. Much of the coverage regarding the CSI conveniently focuses on the past few years while ignoring Shiller’s own data on the matter. The reality is a bit more interesting:
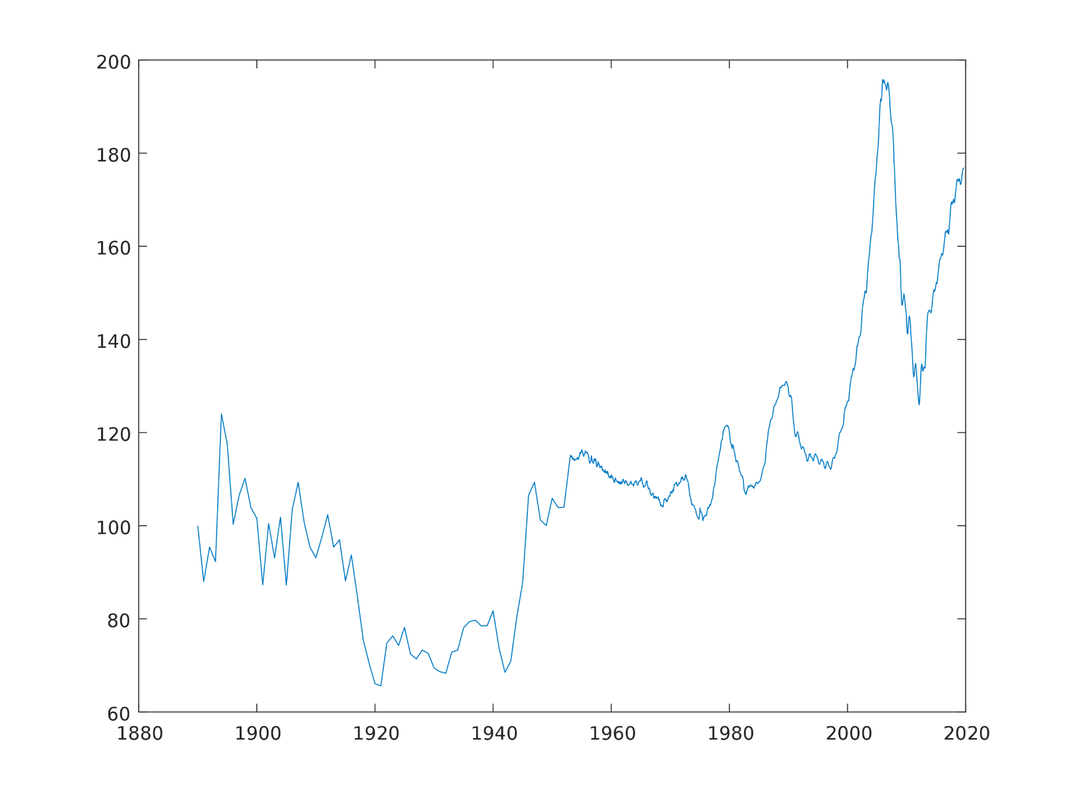
Figure 3: Case Shiller data, inflation-adjusted and indexed to 1890. Source: Prof. Robert Shiller.
Home prices show a strong tendency to return to their 1890s level in real terms. Furthermore, Shiller demonstrates in his book Irrational Exuberance that changes in home price exhibit zero correlation to changes in construction costs, interest rates, or population. First and foremost, historical CSI data reinforce the reality that people are absolutely terrible at predicting the reality of home price appreciation: home purchases are typically infrequent transactions (at least for most people), which when combined with the delusional effects of nostalgia results in unexpected surprise at how much home prices have increased since The Good Old Days™ (precisely when those days were remains the subject of much qualitative speculation). While this insight is hardly surprising, Irrational Exuberance highlights that while homeowners estimate that their homes to appreciate at 2% per year in real terms, the reality is that homes appreciate at about 0.7% over the same interval in the CSI.
Obviously, there are exceptions: Austin has appreciated over 358% since 1998; Oklahoma, Iowa, and Alaska have remained the most stable markets for over twenty years; and hyper-local markets such as Montgomery County, PA have shown extraordinary resilience regardless of broader pressures. But we are discussing broader generalities, not specific exceptions, and the data demonstrate a very strong mean-reverting tendency regardless of spikes and prognostication. Home prices are simply unsustainable as-is, regardless of how much blame we as a country love to (occasionally correctly) heap upon the Fed or private equity firms.
Much of this is due to technology and the mobility it provides. Land as a resource may be scarce – after all, with due respect to Dubai, land is the one thing no one’s making any more of – but its usage is highly skewed. In fact, only 2.6% of the total land area of the United States is urban; another 52% is used for agriculture; mining accounts for 11%; about 3.5% (84 million acres, give or take) is national parks, leaving about 30% of the land area for other uses. Increasing demand for home affordability will undoubtedly pressure government at all levels to ease development restrictions to meet this demand, although this doesn’t address the fact that interest rates remain high – that will be the case, and must be the case, until inflation is back down to the desired level (to co-opt a popular bumper sticker, the beatings will continue until inflation improves). But one thing that was aptly demonstrated during the height of the covid pandemic was mobility: people and businesses are nowhere near as shackled to geography as before, and while certain businesses (e.g. manufacturing, farming) are absolutely constrained by location and the need to have workers onsite, many knowledge-based and technology-leveraged businesses can have employees operate from wherever a reliable internet connection exists.
There have been certain periods where this mean reversion was not exhibited; invariably, these were tied to massive macro events that fundamentally changed the underlying foundations of life in America. For instance, the interwar years showed CSI consistently remaining below its 1890 level, which is easily explained by the start of World War I (wars tend to be expensive and economically disruptive) followed by the 1918 flu pandemic, and the start of the Great Depression after a brief uptick during the Roaring 20s (are we entering a new Roaring 20s for the 21st century? The verdict remains unclear). It wasn’t until the baby boom after World War II (and the Servicemen’s Readjustment Act of 1944 that subsidized home purchases) that home prices began appreciating to a significant degree. Subsequent spikes in the Index represent either speculative bubbles (1976-1982, 1985-1989, 1997-2012) or the massive influx of covid-related spending that turned quantitative easing into a rocketship fueled by more irrational exuberance than common sense.
So the real question to ask is: are we currently in another period of massive macro events that fundamentally shift the underlying foundations of life in America? It’s highly likely that we are.
Are people simply being paranoid?
Probably, but what that means depends on what side you’re standing on, what your personal financial situation is, and what your timeline happens to be. The latest economic data show prices rose just 0.2% from June to July 2023; this is the third straight increase, but on an annual basis prices rose 3.3% in July 2023 compared with 3% in June. This is obviously down from the peak of 2022, but still far above the Fed’s 2% target. This also means that rate hikes are not only still on the table, but will likely be required. Thus, mortgage rates will still rise.
Home prices have spent 2023 either remaining flat or climbing, but assuming that this will continue forever ignores the economic realities that allowed this to happen in the first place. Rates cannot stay high forever: it’s a simple fact that economic expansion is inversely proportional to the prevailing rate, meaning the Fed will eventually be forced to slash rates or crash the economy. People also have notoriously short memories: not only did the current housing boom begin in 2012 – meaning a downturn in the housing market would be in line with the historically decadal real estate market cycle – but rates have been so low for so long that many have forgotten (or refuse to recall) that we are currently very near the 70-year average of the Federal Funds Effective Rate (Fig. 4).
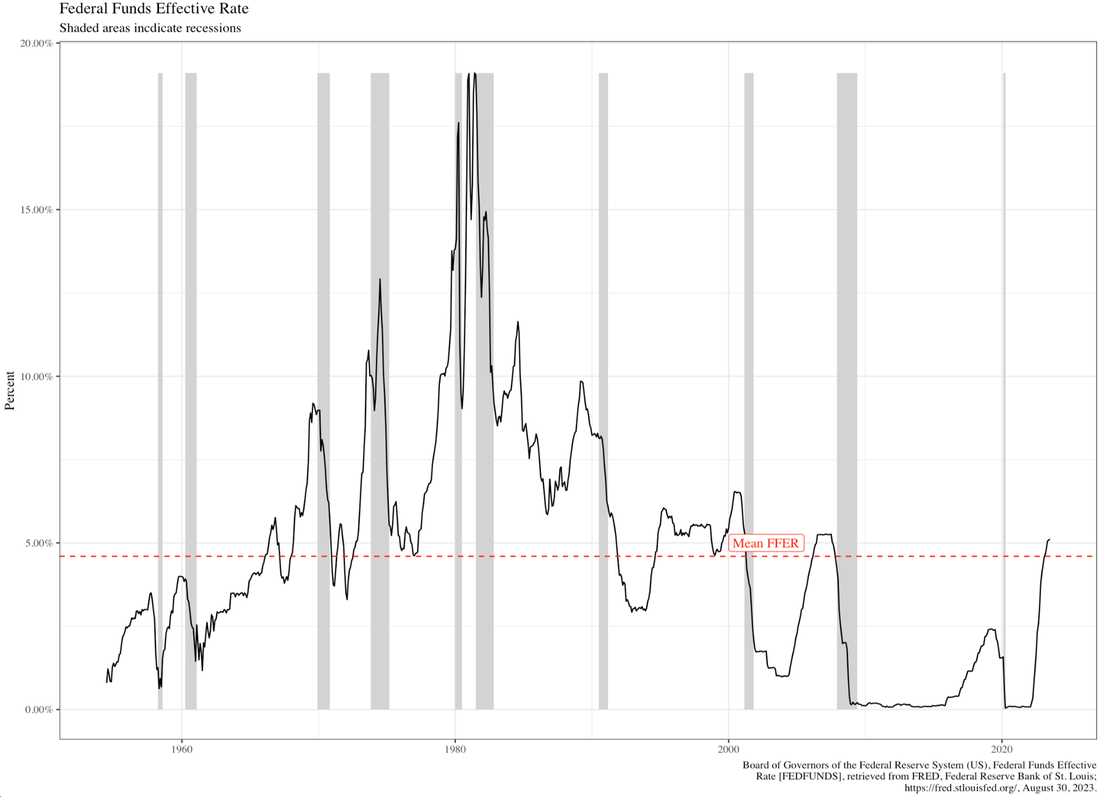
Figure 4: Federal Funds Effective Rate. Source: FRED.
While it’s dangerous to assume history will always repeat, it’s safe to conclude that it at least rhymes, and it’s interesting to note that recessions inevitably follow when rates are above the historical average – almost as if the Phillips Curve was real, after all…
The average American isn’t the only party feeling the sting: Redfin data show that investors can’t even afford to play in the sandbox anymore: growth in investor purchases is not only strongly negative on a national basis, but are lower than at any time since the 2008 crisis (see Fig. 5). Some even claim the Fed may have permanently broken the housing market, as interest rate hikes weigh in on both supply and demand: prospective homebuyers are priced out due to high rates, and existing homeowners desperately – and logically – cling to their low-rate mortgages since they know they won’t be able to afford anything else if they sell (unless they’re willing to accept some serious downgrades). The bad news is that both supply and demand have come down, but the market remains deadlocked. The worse news is that rate hikes must continue until inflation is under control, and the acceleration of prices in July means that’s not likely to happen anytime soon.
The beatings will continue until inflation improves.
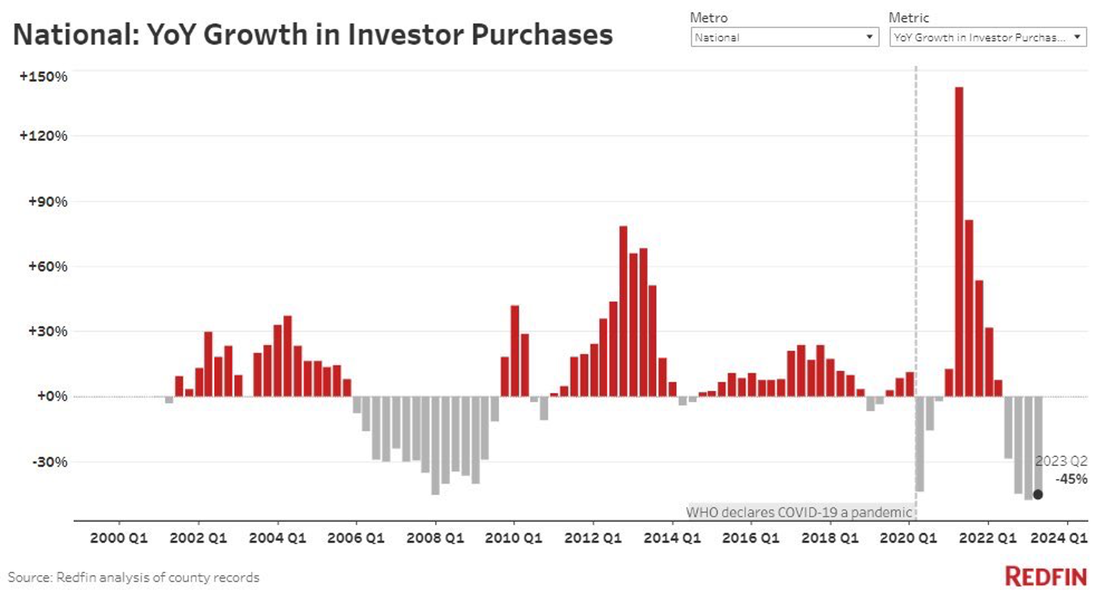
Figure 5: National year-on-year growth in investor purchases. Source: Redfin.
We’ve never believed Chair Powell’s insistence that a soft landing is possible, but a “softer” landing may actually be in the cards and would be far preferable to a crash. This contraction would probably not happen until late 2024, which would necessitate rate cuts and likely restart the housing market: this means increased inventory, increased new-starts, and increasing supply leading to falling prices. We’re not the only ones who feel this way: Morgan Stanley analysts have said pretty much the same thing. Recession pressures have historically driven down the CSI, and to be frank there’s nothing outside of the interest rate environment that will support the current housing deadlock: pandemic stimulus spending is likely over, the student loan repayment moratorium is ending, and consumer revolver credit is over $1 trillion for the first time ever. There’s only one direction for the economy to go, and it’s in the direction no one wants to admit is not only a possibility, but the only logical outcome.
Those who bemoan the housing deadlock would be wise to spend their time building dry powder for the inevitable buyer’s market to follow.
Subscribe to updates or if you have any questions or comments, please email us at: [email protected]
Follow our CEO: @thevinhvuong
Follow Garrison Fathom: @garrisonfathom
Follow our CEO: @thevinhvuong
Follow Garrison Fathom: @garrisonfathom